Social network analysis (SNA) is a technique for understanding the structure of social networks and the underlying relationships between people, organizations, resources, and ideas. It examines how these entities and the social forces connecting them (e.g., communication, collaboration, etc.) interact to create and sustain patterns of behaviour. Through this examination, SNA can provide insight into the dynamics of social networks and how they may lead to outcomes such as problem solving, information sharing, or the development of norms and behaviours. By analysing the communication and information flows, it becomes possible to identify influential individuals or groups, and to understand how a network’s structural arrangement affects its efficiency and efficacy. SNA can also provide insight into how the network could be altered to achieve desired outcomes, such as increasing collaboration or participation. That’s enables team leaders and project managers to take specific and informed action to enhance their team´s outcomes and thus overall team effectiveness.
According to existing empirical studies, team, and project leaders` decisions can rely on SNA graphs to make decision on how to manage team-level processes in the teams they lead and thus shape positive emerging states in such teams. In many teams, the mainly causes of personality-related conflict derive from divergences in team members` personal situations and motives, also known as individual-level inputs.
Building an SNA Network
Before building an SNA Network graph we should clarify some essential terms to better understand the structure.
First, when conducting a large-scale SNA, each social actor of a collective is referred to as a “node”. Similarly, within a smaller collective, such as a workgroup or a team, each team member is referred to as a “node”, and the relationship between two nodes (eg. Friendship or animosity) is referred to as a “tie” expresses a form of social relationship that has a direction, valence, and strength.
A tie`s direction can be bidirectional (e.g., both Juan and Bruno see each other as friends), it could be unidirectional (Juan considers Bruno as a friend, but Bruno does not reciprocate such friendship), or express no relationship at all.
Second, the valence of a tie refers to the nature of the relationship. For example, Juan and Bruno can be friends (that means a positive valence, usually expressed with “+”) or adversaries (a negative valence, usually expressed with “-“).
Third, ties might differ in strength (e.g. if Juan sent 20 emails to Bruno, but only 2 emails to Manuel, the tie connecting Juan and Bruno is “stronger” than the tie connecting Juan and Manuel).
Finally, the fourth critical element of an DNA isa “community”, which occurs when several actors have a common characteristic that “binds them together.
1 – MAP THE INDIVIDUAL CHARACTERISTICS AND CIRCUMSTANCES OF SOCIAL ACTORS AS NODE ATTRIBUTES
The first step in using SNA to explore intra-group relationships is to outline the four types of unique features of the social actors: 1) What are the unique strengths of each team member? 2) What are the unique weaknesses of each team member? 3) What are each team member`s motivations? 4) Are there any personal situations the team leader should be aware of?
A practical way to map such individual inputs:
| Social Actor | Strengths | Weakness | Personal Motives | Personal Situation |
| Bruno | Critical thinker | Overthinks Things | Monetary incentives | Mortgage loan |
| Juan | Numbers expert | Not a public speaker | Increased social status | ? |
| Manuel | Good with people | Usually unfocused | Wants to leave a legacy | Retiring soon |
When considering the personal situations of each team member, team leaders need to rely on not only their leader character dimension of humanity, but also their drive and transcendence, to communicate the team goals and their associated rewards in a way that satisfies the personal motives of the team members.
2 – USE AN ADJACENCY MATRIX TO MAP SOCIAL RELATIONSHIPS BETWEEN SOCIAL ACTORS
The second step to conduct an SNA is to construct an adjacency matrix. In short, an adjacency matrix consists of a collection of social actors that are distributed in rows and columns so that each social actor has the same row and column number. Information regarding the social relationship between two social actors will comprise the content of the respective cell.
Constructing an adjacency matrix gives users the advantage of easily spotting information gaps in the social relationships within teams. Once the adjacency matrix is constructed, an “empty” graph can be constructed. In this context, an “empty” graph represents the main actors or nodes and their properties: strengths, weaknesses, personal motives, and personal situations.
In SNA, the content of the adjacency matrix can derive from qualitative or quantitative information. Qualitative information usually reflects an external assessment of social relationships, whereas an adjacency matrix based on quantitative information usually includes objective data. Given that social relationships might or might not be reciprocated, it is essential to express the direction of the relationship between two social actors.
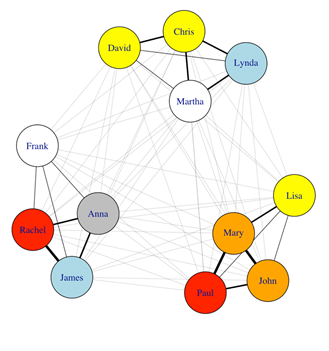
3 – USE SNA GRAPHS TO MANAGE SOCIAL RELATIONSHIPS WITHIN TEAMS
Constructing a graph is a practical way to make sense of node attributes. For “large-world” – networks- that is, social networks involving dozens, hundreds or even millions of actors – relying on statistical software packages and visualization algorithms is a must. As the number of nodes increases, and thus the size of the adjacency matrix expands, the need to rely on graphs to make sense of the data becomes stronger. For “small-world “networks, which display relationships among four to 10 social actors, graphs can be constructed manually.
The first step is to situate each node in a space, alongside a description of its unique characteristics. Also, different node colours or shapes can be used to map the communities that the social actor belongs to. The second step is to draw the ties depicted in the adjacency matrix, distinguishing their direction and valence. When ties do not overlap, the resulting graphs are clearer and more informative than graphs with ties that cross over each other. Finally, the third step is to identify “structural holes” in the graph, which refers to the social actors that serve as “brokers” by connecting different communities.
Team leaders can use the information resulting to enhance their team`s effectiveness. They can decide how to leverage their team`s individual-level inputs to the collective advantage of the team. For example, when team leaders are trying to gain their team members` commitment toward a collective goal, the language they use might vary, depending on the team members` personal situations and motives.
Finally, it is important to understand that the cyclical nature of team dynamics will affect the relationship between team leaders and team members. More precisely, as a team gains experience and develops, team outcomes will influence both individual-level and team-level inputs, and thus the number of ties might increase (or decrease). Therefore, as their team evolves, team leaders should update their SNA graph accordingly. Contrasting and comparing different SNA snapshots can provide team leaders with additional insights regarding whether group process and emerging states have consolidated, or whether further action is needed to sustain their team effectiveness.